
Online help
The web host accessible to all
Procédure
Real User Monitoring, or RUM, is a tracking feature built into the LWS Optimize plugin that lets you see how your site actually performs for your visitors. Unlike traditional performance tests using online tools (such as PageSpeed, for example), RUM collects data from your visitors and therefore returns real usage statistics.
The result: a dashboard that shows you which pages are the slowest and where to focus your optimization efforts, without having to interpret complex reports.
RUM measures your site [PERSON_NAME] performance as experienced by your visitors: loading time, click responsiveness, visual stability. This data is grouped in a dedicated dashboard, separate from the rest of the options, to easily identify the slowest pages and pinpoint the areas to optimize where they will have the greatest impact.
No personal data is collected about visitors: no IP address is recorded, no cookie. [PERSON_NAME] the access date and the type of device used (PC, mobile) are saved
To enable RUM, go to the LWS Optimize plugin dashboard. Then access advanced mode, in the Front-End tab where you will find an item Real User Monitoring (RUM). Check the box and save your changes.
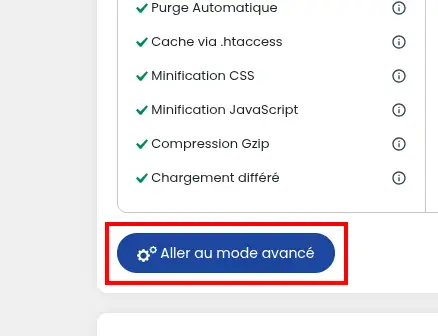

Once enabled, the plugin automatically injects a small script on each public page of your site. This script runs discreetly in each visitor's browser to measure page performance. Data starts being collected from the very first visit.
The statistics generated from visitor data are stored in the database and accessible via a dedicated dashboard, [ADDRESS] the plugin's general dashboard. [PERSON_NAME], hover your mouse over the LWSOptimize button in the left bar and select RUM Dashboard in the submenu.
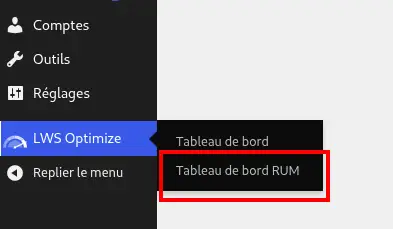
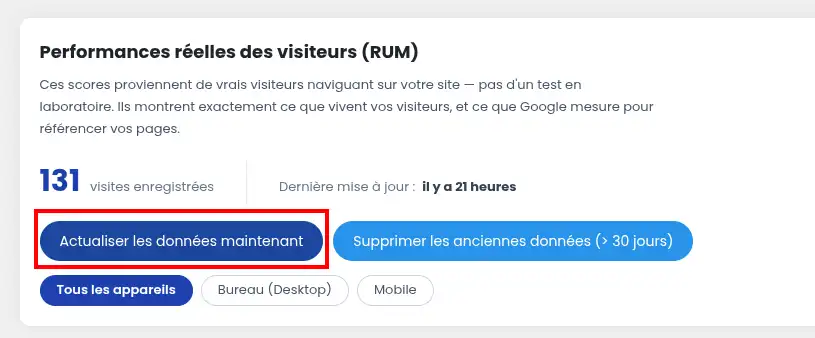
On this new page, you will mainly find some information about the type of statistics collected and their number.
The statistics are processed and compiled automatically every day, but you can update them at any time by clicking the Refresh data now button.
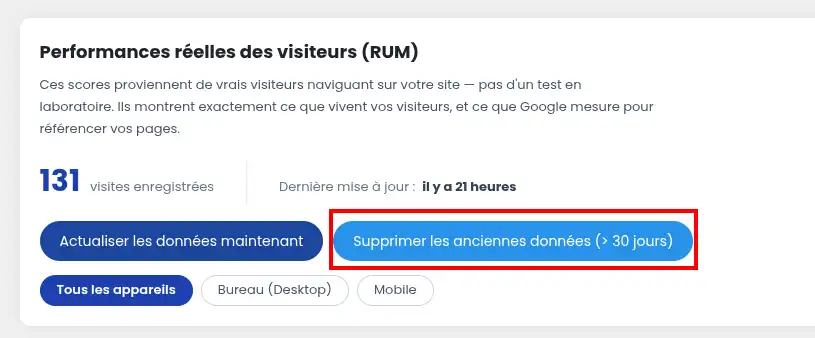
Conversely, you can delete the oldest data so as not to poison the statistics with old, outdated data.
The dashboard displays the 20 slowest pages on your site, ranked from slowest to fastest. For each page, four metrics are displayed at p75, that is, the value below which 75% of your visitors fall. In other words, if a page shows an LCP of 3 seconds, [PERSON_NAME] 75% of your visitors loaded that page in 3 seconds or less.
Here is what each of these metrics measures:
LCP — Largest Contentful Paint
LCP measures the time it takes before the main content of the page becomes visible on screen, for example a cover image or a title. It is often the first impression [PERSON_NAME] visitors have of how fast your site is. A good score is below 2.5 seconds. Beyond that, the chances that they will leave the page increase significantly.
INP — Interaction to Next Paint
INP measures how responsive the page is when a visitor interacts with it, such as clicking a button or opening a menu. A site that responds slowly to [PERSON_NAME] actions can create a frustrating feeling of slowness for [PERSON_NAME], even if the initial load is fast. A good score is below 200 milliseconds.
CLS — Cumulative Layout Shift
CLS measures the visual stability of the page during loading. In other words, how much the elements of your page move as it loads, which can cause accidental clicks. If images or ads load after the text and shift the layout, your CLS will be high and [PERSON_NAME]. A good score is below 0.1.
TTFB — Time to First Byte
TTFB measures the time it takes your server to respond to the browser's first request. It is the starting point for loading each page: a high TTFB slows down everything else. A good score is below 800 milliseconds.
However, it is more difficult to improve this value, because it depends heavily on your host and hosting
A colored indicator (green, orange, or red) accompanies each metric to show you at a glance whether your site meets the thresholds recommended by Google Core Web Vitals.
On high-traffic sites, the plugin automatically records one measurement out of ten when more than 1,000 visits are waiting to be processed. This mechanism helps avoid overloading the database while keeping statistics representative of your entire traffic.
Real User Monitoring in LWS Optimize is a valuable tool for understanding your site's performance as it is truly experienced by your visitors 🚀. Thanks to it, you can finally go beyond simple tests [PERSON_NAME] real data, clear and actionable 🙂.
You now know how to: identify the slowest pages on your site, analyze the main Core Web Vitals metrics such as LCP, INP, CLS and TTFB, enable real user monitoring in the plugin, view and filter statistics by device, force data aggregation, purge old measurements and prioritize your optimizations [PERSON_NAME] the user experience ✨.
In just a few clicks, you therefore have a useful dashboard that is easy to read and focused on the essentials: making your site faster, smoother and more stable for your visitors 👌.
Thank you for reading 🙏 and feel free to leave a comment on the service to share your opinion or experience with LWS Optimize !
Ask the LWS team and the community. Answers are published after moderation.
 About LWS :
LWS is a 100% French web hosting company that focuses on quality and innovation and offers a responsive and competent technical service at affordable prices.
About LWS :
LWS is a 100% French web hosting company that focuses on quality and innovation and offers a responsive and competent technical service at affordable prices.



 Yes
Yes No
No