Contact us
 Customer Area


 Visit LWS
Rate this article :
This article was useful to you ?
 Yes
Yes
 No
No
 Article read
14996 once
Article read
14996 once Merci ! N'hésitez pas à
poser des questions sur nos documentations si vous souhaitez plus d'informations et nous aider à les
améliorer.
Merci ! N'hésitez pas à
poser des questions sur nos documentations si vous souhaitez plus d'informations et nous aider à les
améliorer.Vous avez noté 0 étoile(s)



Sommaire
Procédure
Service concerned : WordPress
Panel concerned : WordPress dashboard
Level : intermediate
When a WordPress site communicates with an external service, it makes an HTTP request. These communications are notably used to check for updates, contact an API, or synchronize a plugin.
The Log HTTP Requests plugin allows you to record these requests in order to identify an error or an abnormally slow communication.
This plugin [ADDRESS] outgoing requests made using the WordPress HTTP API. It does not allow you to view visits received by your site nor all the network traffic of your hosting.
You must have a WordPress account authorized to install and activate plugins.
You must also be able to reproduce the action to be analyzed, for example submitting a form, a synchronization, a check for updates, or connecting to an external service.
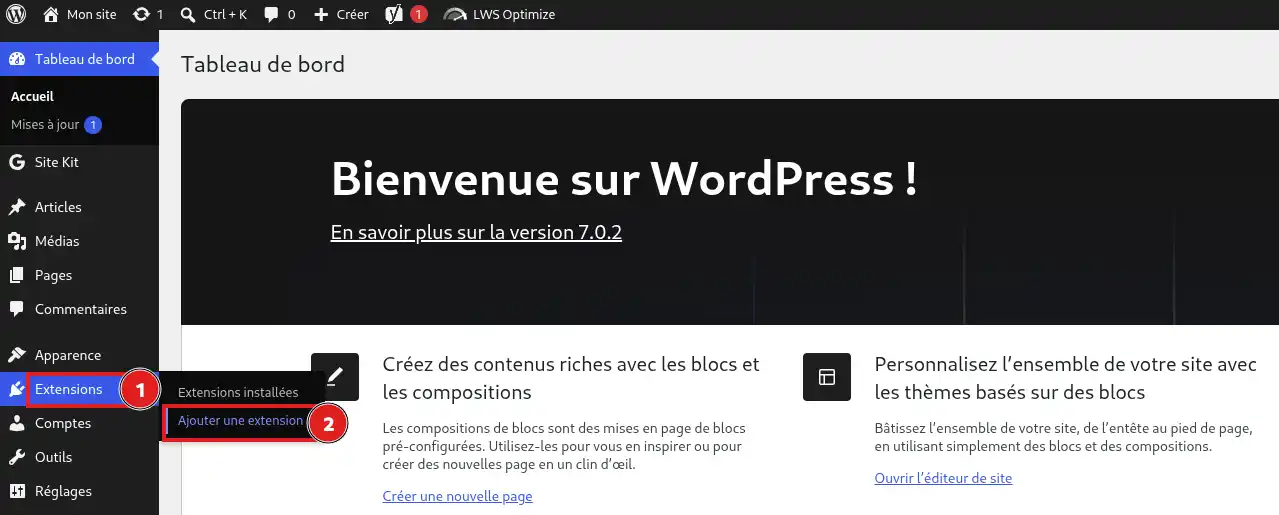
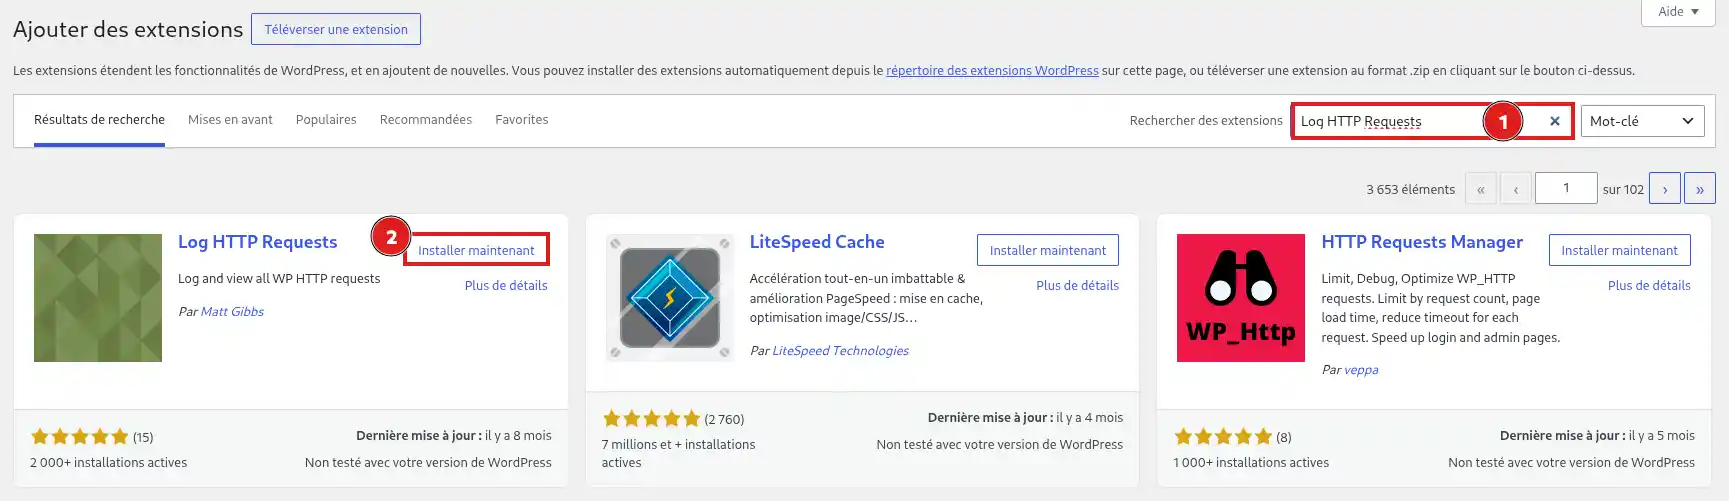
Recording of new HTTP requests starts as soon as the plugin is activated.
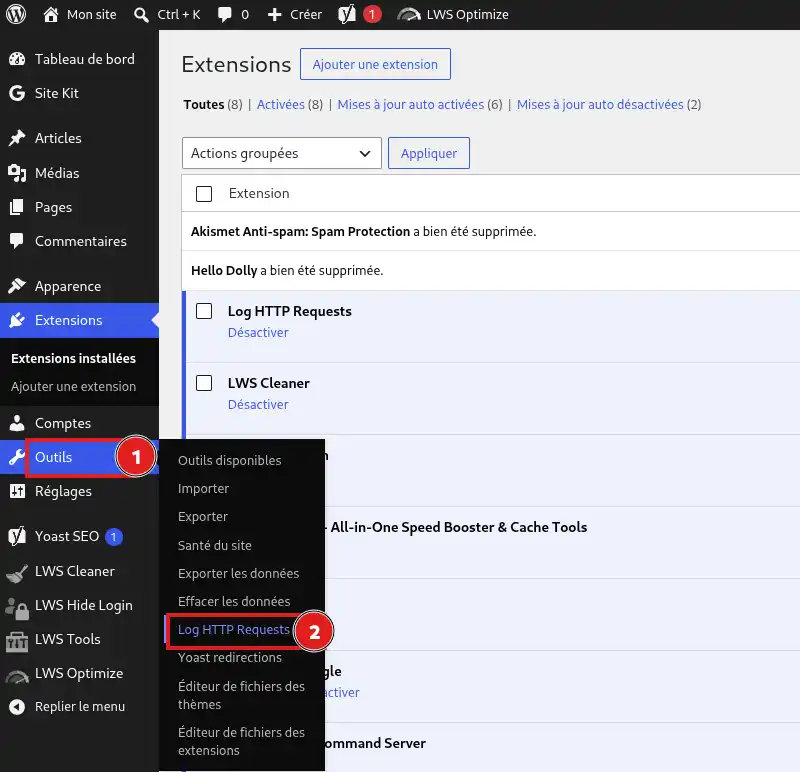
In the left-hand WordPress menu, click Tools, then Log HTTP Requests.
The table shows the main information for each communication:
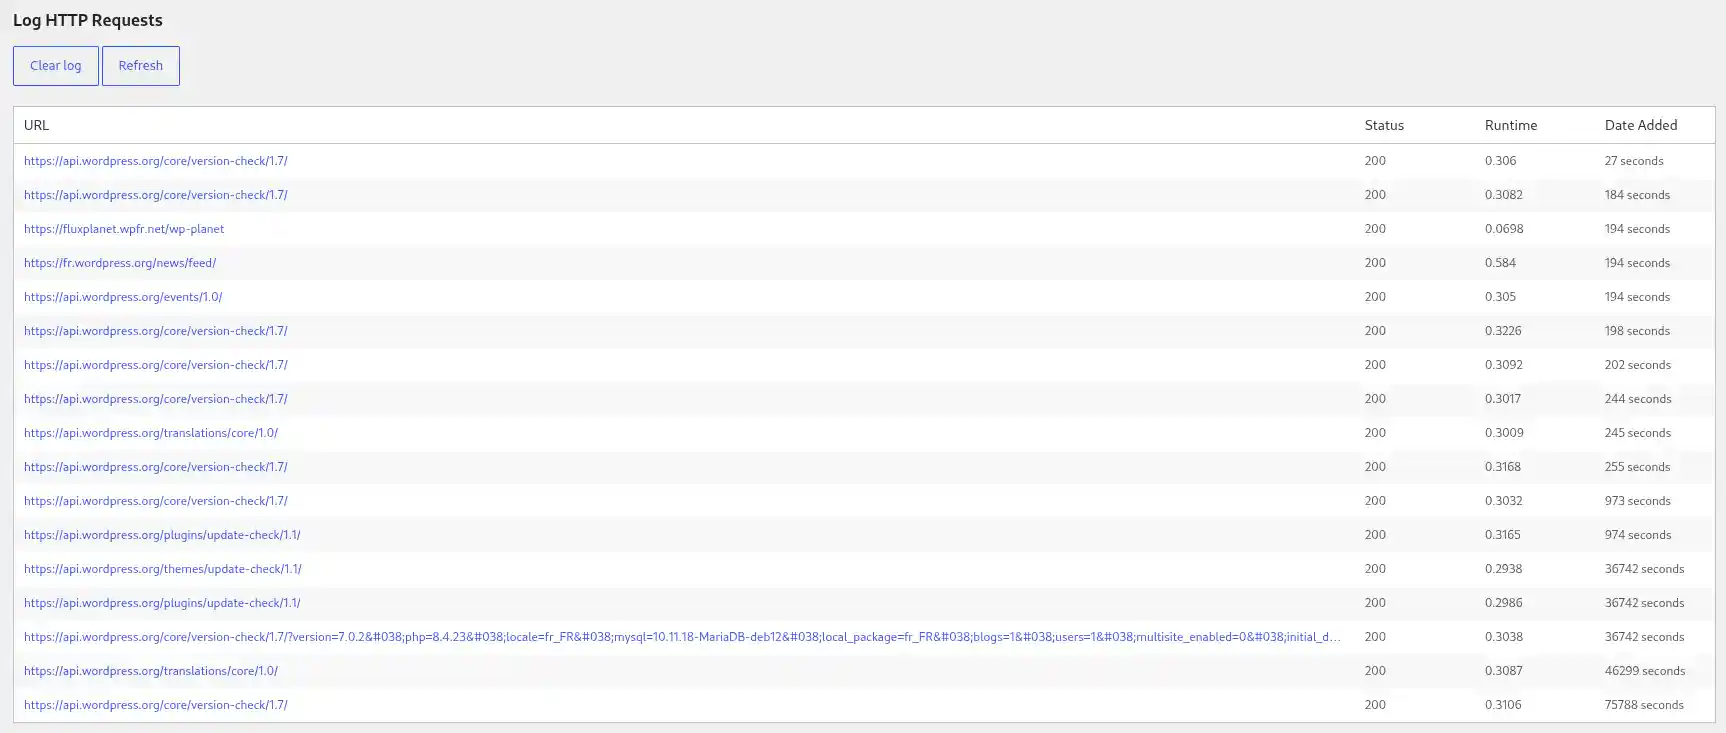
Click a row to display the details of the sent request and the received response.
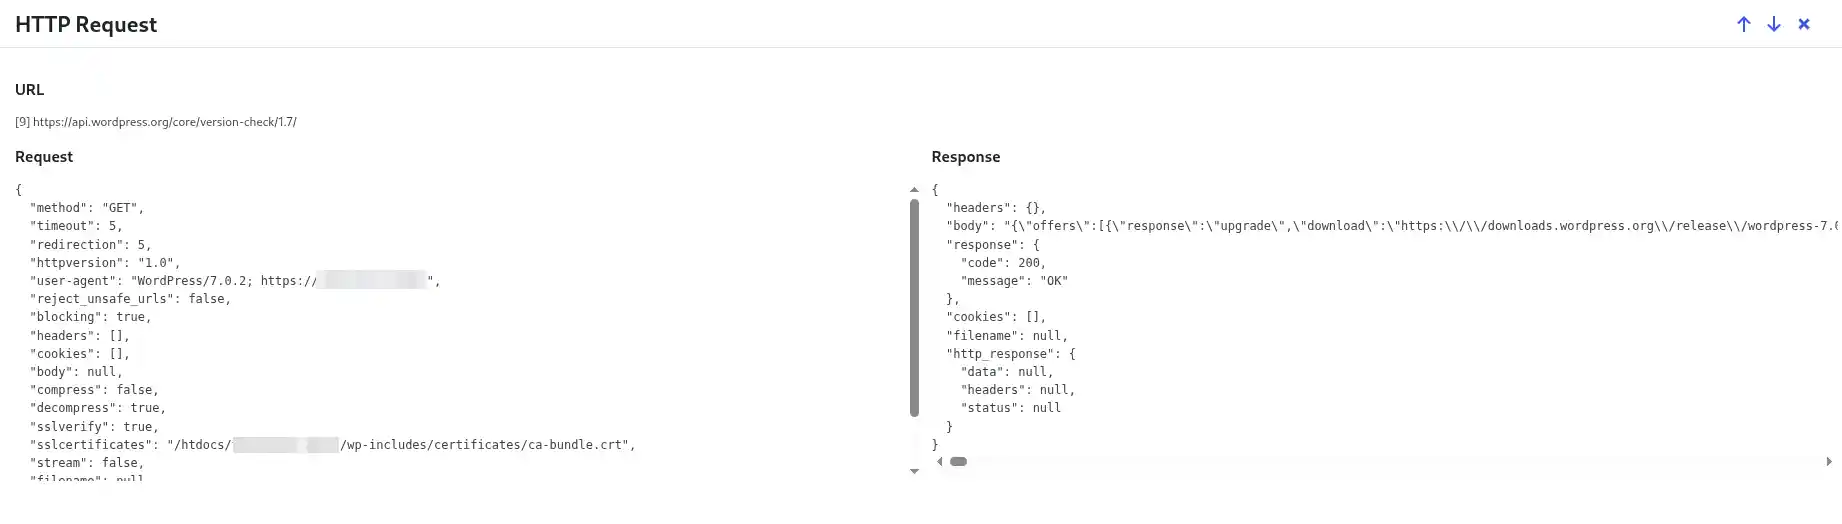
The interface also offers the Refresh button to update the list and Clear log to delete the recorded entries.
To identify a specific request:
A code between 200 and 299 generally indicates that the remote server responded correctly. A code beginning with 4 or 5 generally indicates a refused request or an error encountered by the remote service.
A high runtime can indicate a slow communication. However, there is no maximum duration that applies in all situations: the result must be compared with the usual behavior of the service concerned.
A request's details may contain personal data, an API key, an access token, or other confidential information. Always check their content before sending a screenshot or a copy of the log.
After having [PERSON_NAME], a new line should appear with the address of the contacted service, its [PERSON_NAME] communication code.
The new request appears in the log: the plugin is working and you can consult its details to continue the diagnosis.
Once the diagnosis is complete, click Clear log if you want to delete the recorded entries. You can then deactivate and delete the plugin if you no longer need it.
I don’t see the “Add Plugin” button
Your WordPress account probably does not have the required permissions. Log in with an administrator account.
On a WordPress multisite network, plugin installation may be reserved for the network super administrator.
I can’t find the plugin in the “Settings” menu
The plugin is accessible from Tools > Log HTTP Requests and not from the Settings menu.
No new request appears
Check that the plugin is activated, then reproduce the action again before clicking Refresh.
Some communications do not go through the WordPress HTTP API. In that case, they cannot be recorded by this plugin.
The log contains too many requests
Click Clear log, reproduce only the action to analyze, then immediately click Refresh. This will make it easier to identify the communication you are looking for.
The status shows 200, but the feature does not work
The 200 code confirms that the remote server responded, [PERSON_NAME] to the service or application.
Click the relevant row and check the Response section to examine the response content.
Rate this article :
This article was useful to you ?
Yes
No
17mn reading
How do I update WordPress to the latest version?
1mn reading
How does Yoast SEO work?
4mn reading
How can you optimise your Wordpress site?
1mn reading
How do I use Gutenberg on Wordpress?
 About LWS :
LWS is a 100% French web hosting company that focuses on quality and innovation and offers a responsive and competent technical service at affordable prices.
About LWS :
LWS is a 100% French web hosting company that focuses on quality and innovation and offers a responsive and competent technical service at affordable prices.