
Online help
The web host accessible to all
Procédure
To check the status and usage of your VPS server, go to the dedicated section of your LWS client area. This interface lets you view the allocated hardware specifications, the active operating system, and real-time activity metrics. We will see how to access the KVM dashboard and analyze your usage graphs.
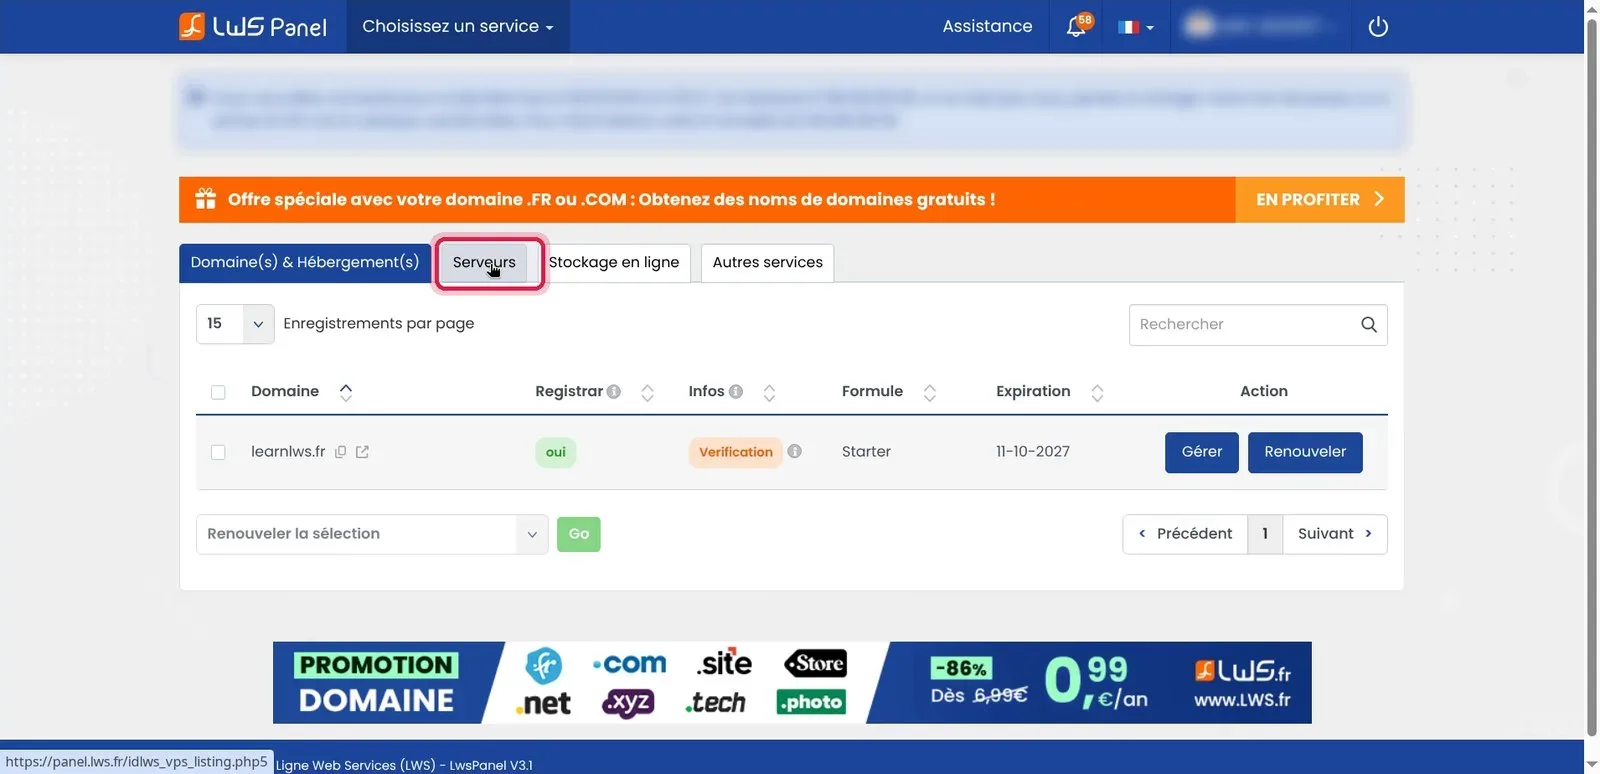
Log in to your LWS client area. In the service management menu, click the Servers tab to display all of your virtual machines.
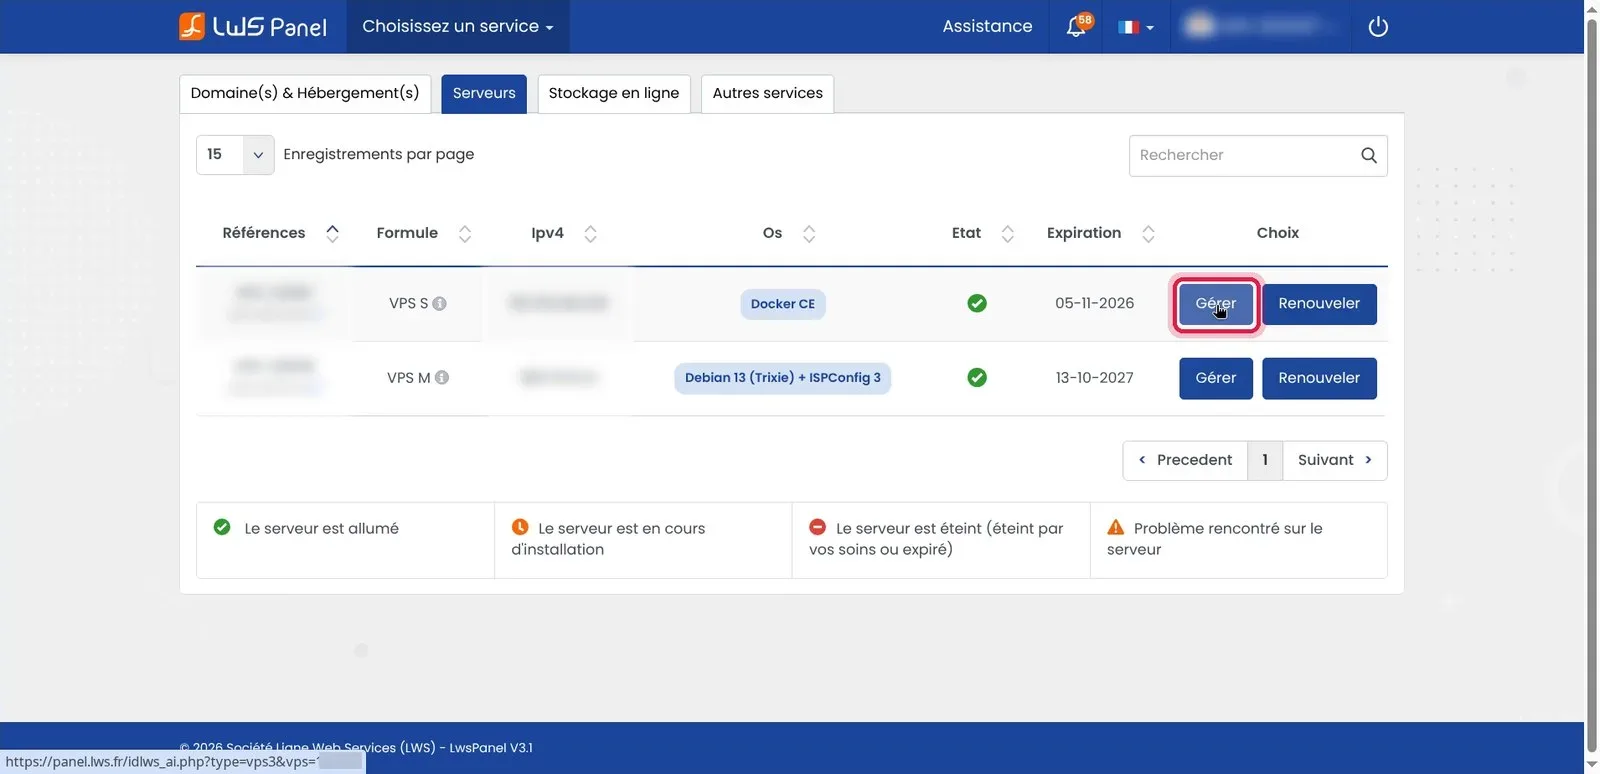
In the list of your machines, find the row corresponding to your VPS server. Then click the blue Manage button in the Choice column to open the KVM management interface.
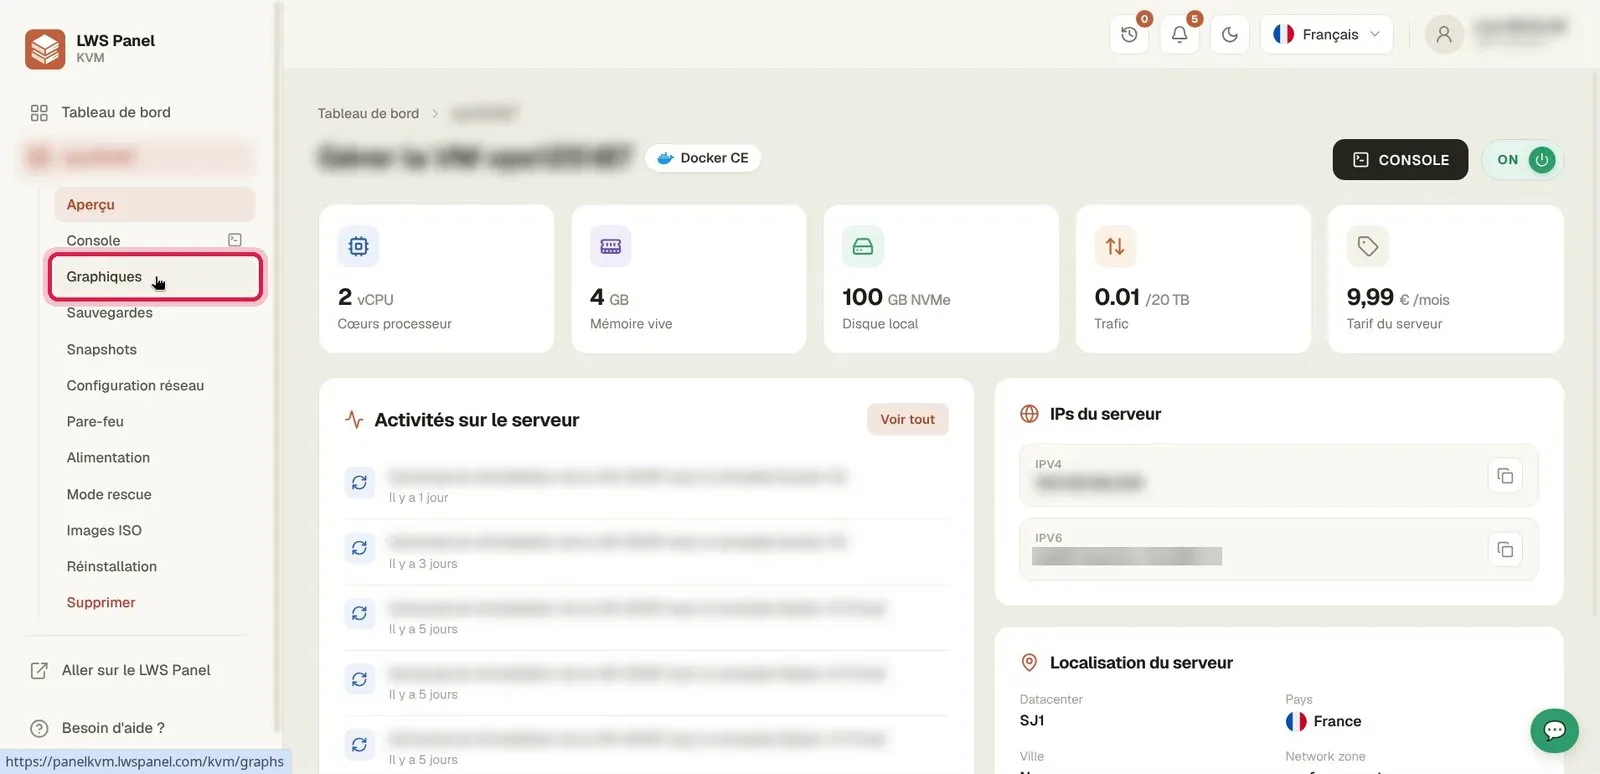
As soon as you arrive on the Overview page of the KVM panel, the installed operating system is displayed at the top of the page, along with the server's powered-on status with the ON button. The information blocks summarize the allocated configuration: number of processor cores (vCPU), RAM (RAM), storage capacity (Local disk), monthly Traffic quota, and network addresses (IPv4 and IPv6).
In the side menu on the left of your screen, click the Graphs tab. This view brings together the usage history of your hardware components.
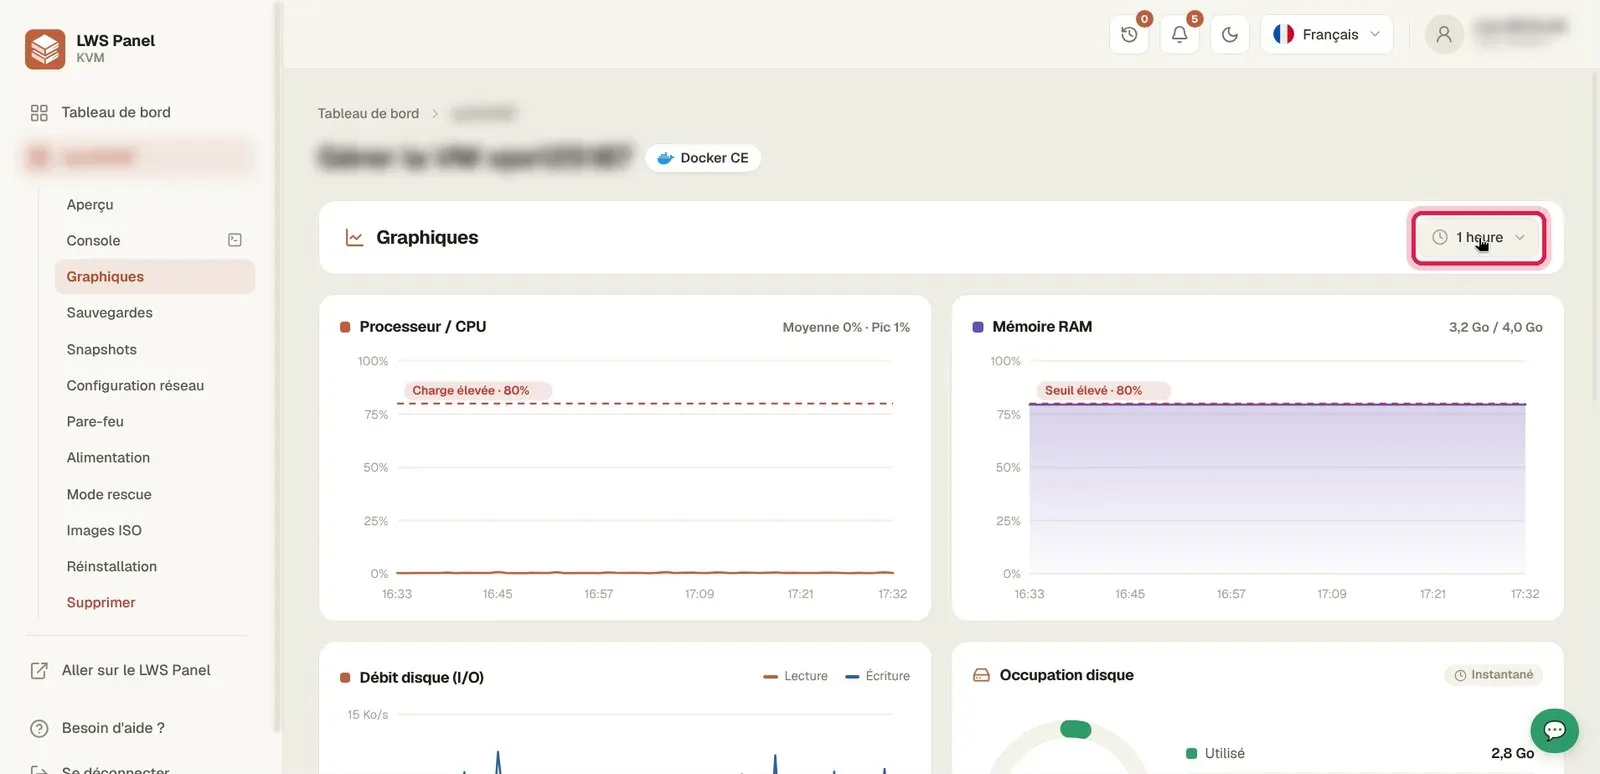
By default, the indicators show the load recorded over the last hour. To widen the observation range, click the time selector at the top right showing 1 hour.
In the drop-down list that appears, select the 24 hours option. The graphs update to reflect the full activity of the past day.
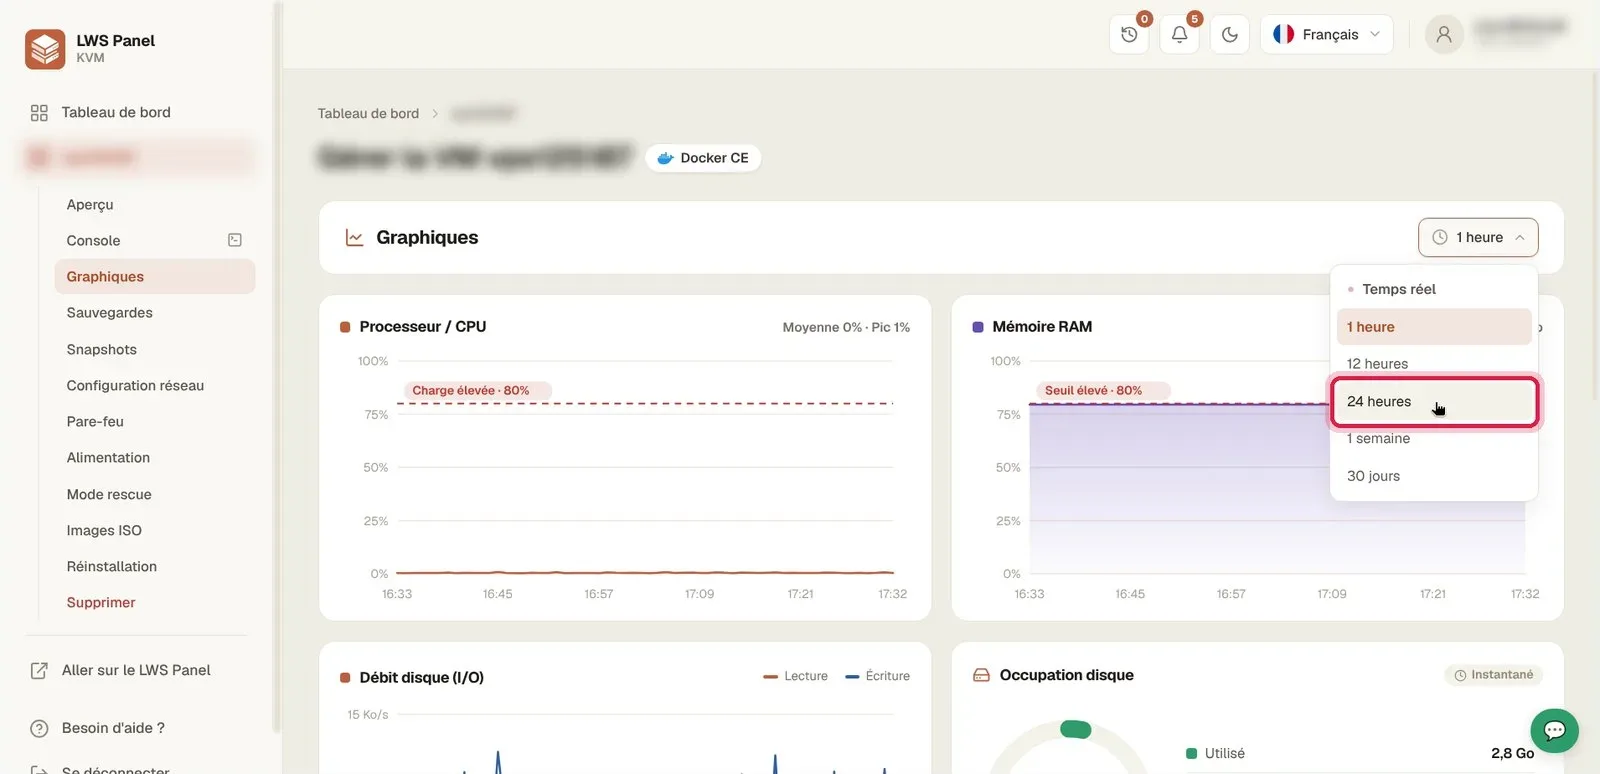
Observe the Processor / CPU and RAM memory graphs: a red dashed line indicates the high-load threshold set at 80%. Scroll down the page to monitor Disk throughput (I/O), Disk usage, and network traffic volume to identify possible usage spikes.
This visual threshold defines a zone of sustained usage. If your processor or memory graphs exceed it for an extended period, your VPS may experience slowdowns.
This monitoring interface is read-only for viewing metrics. To reboot, reinstall, or modify your machine, use the other items in the side menu.
The drop-down menu offers real-time monitoring over 1 hour, 12 hours, 24 hours, 1 week, or 30 days to analyze long-term trends.
No, the metrics are collected by the KVM virtualization infrastructure in the background without using your machine's operating system.
Ask the LWS team and the community. Answers are published after moderation.
 About LWS :
LWS is a 100% French web hosting company that focuses on quality and innovation and offers a responsive and competent technical service at affordable prices.
About LWS :
LWS is a 100% French web hosting company that focuses on quality and innovation and offers a responsive and competent technical service at affordable prices.



 Yes
Yes No
No