
Online help
The web host accessible to all
Procédure
On an LWS Panel web hosting plan, your site’s logs (access logs, PHP errors, requests blocked by the ModSecurity firewall) can be viewed in the LWS Log Analyzer tool. You open it from the “Logs Apache PHP ModSecurity” icon in the “Databases & PHP” section. It displays logs in real time, over a period ranging from 24 hours to 7 days, and lets you download raw access logs.
In your LWS customer area, under the “Domain(s) & Hosting(s)” tab, click “Manage” next to the hosting plan concerned. If you cannot log in, see the help article How do I log in to my LWS account and resolve login issues?
In the “Databases & PHP” section, click the “Logs Apache PHP ModSecurity” icon.
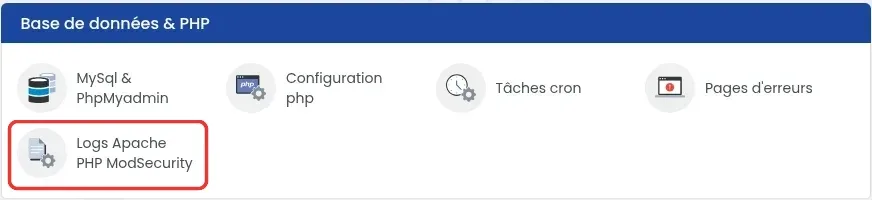
The LWS Log Analyzer tool opens on a server-specific address for your hosting plan, not on panel.lws.fr. To return to the panel, use the arrow at the top left.
The first time, a 4-step guided tour asks you to choose the language (“Français” or “English”) and then introduces the tool. Click “Next” until “Let's go!”, or click “Skip” to close it.
At the top of each page, you will find the same settings:
The logs update automatically, about every 15 seconds (indicated by “Auto-refresh” at the top of the screen). Each indicator has a “?” explaining what it counts.
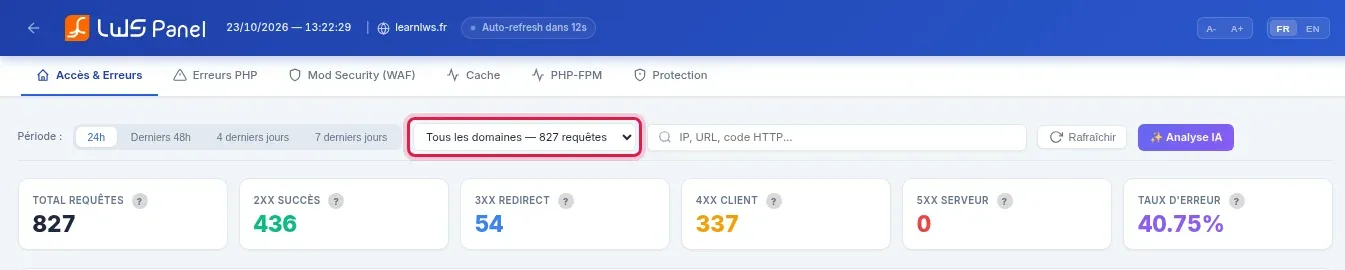
This tab replaces the old access log (access.log). It lists all requests made to your site by visitors and bots: counters by response type (2XX success, 3XX redirect, 4XX client, 5XX server, error rate), chart of requests per hour, most frequent IP addresses, pages and countries. The “4xx” and “5xx” filters keep only errors; the “> 1s”, “> 2s” and “> 5s” filters keep slow requests.
Each row in the table shows the date, the visitor’s IP address, the method (GET to display a page, POST for a form submission or login), the requested address, the response code, the size and the duration.
This tab replaces the old PHP log (PHP.log). It counts errors by severity: “FATAL / PARSE” (critical errors that block the page), “WARNING”, “NOTICE”, “DEPRECATED” (obsolete functions). It also shows the most problematic files.
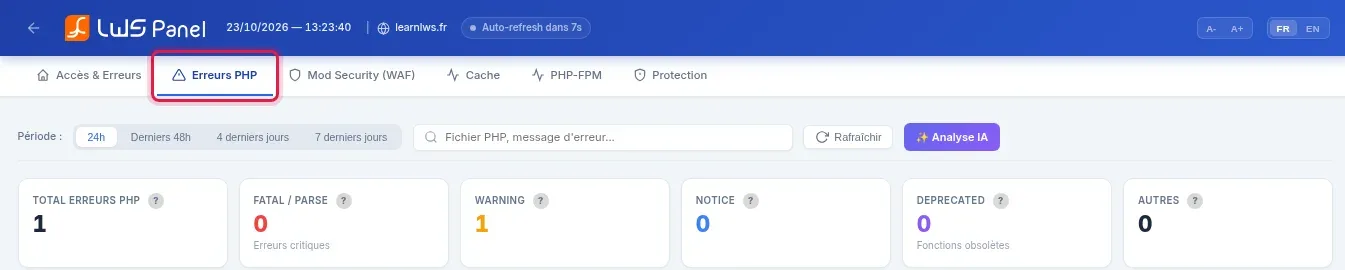
In the table, the “All”, “Fatal”, “Warning”, “Notice” and “Deprecated” filters sort the errors. The “PHP FILE” and “LINE” columns indicate where the error occurs, and the “MESSAGE” column gives the exact text.

This tab replaces the old ModSecurity log (ModSecurity.log). It counts blocked attacks and lists, for each request, the IP address, the target address, the rule number triggered and the “🚫 Blocked” status. A visitor whose request is blocked by a rule receives a 406 error. The “🚫 Blocked only” button hides the rest. Many blocked requests to /.env or /.git/config from foreign addresses are bots looking for secret files: this is normal.
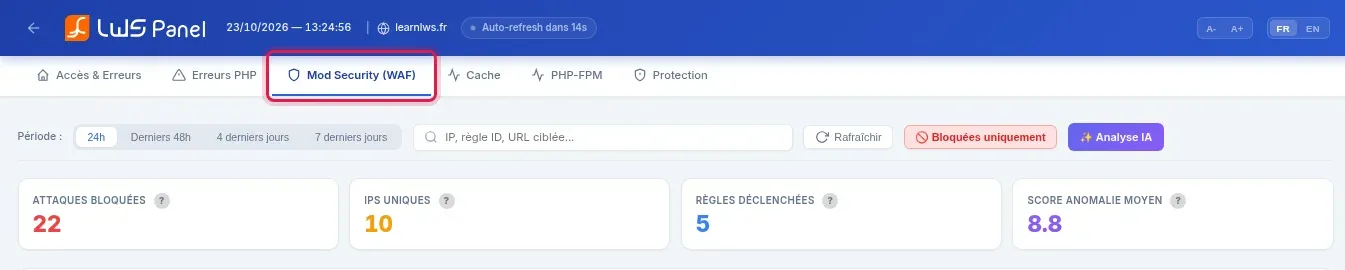
Firewall settings are not configured here: they are found in the “Mod security” icon in the “Security” section of the LWS Panel.
Choose the period covering the time of the problem (“24h”, or more if the error is older) and, if needed, the relevant domain.
Find the row corresponding to the time of the problem. The “PHP FILE” and “LINE” columns identify the file involved: on WordPress, an address such as /wp-content/plugins/extension-name/ indicates the extension causing the issue.
Click “✨ AI Diagnostic” at the end of the row, then “✨ Analyze with AI”. After 15 to 30 seconds, the tool explains the meaning of the error, its likely cause and the steps to fix it.
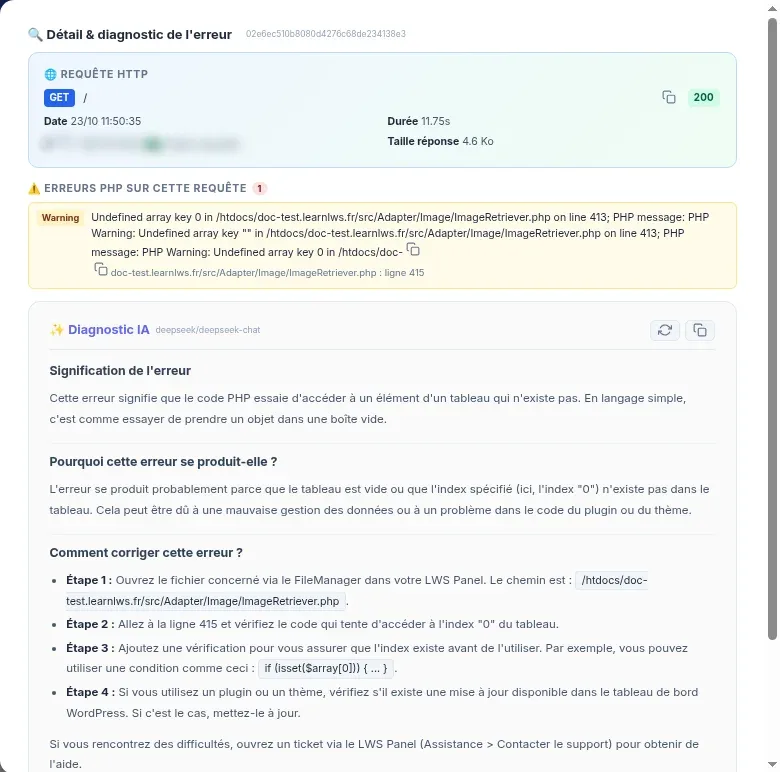
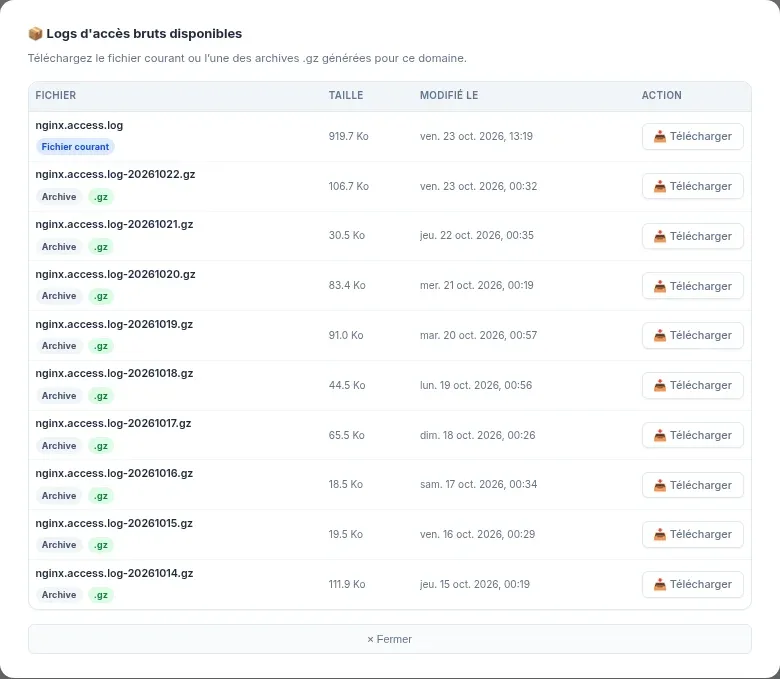
In the “Access & Errors” tab, scroll to the bottom of the page to “Export your data” and click “📦 Raw logs”.
Click “📥 Download” next to the file: “nginx.access.log” for today’s log, or the “nginx.access.log-YYYYMMDD.gz” archive for the desired day. Archives cover the last 15 days.
To export only part of the requests (for example, 404 errors for a domain), first set the period, domain and filters, then click “📥 Filtered CSV”.
The old “Apache and PHP Logs” screen has been replaced by LWS Log Analyzer. PHP errors are in the “PHP Errors” tab, requests with errors in “Access & Errors” (the “4xx” and “5xx” filters), and firewall blocks in “Mod Security (WAF)”.
Check the period (switch to “Last 7 days” if the problem is old) and the selected domain in the list. If the “PHP Errors” tab remains empty, look at “Access & Errors” with the “5xx” filter, then the “Protection” tab.
A request blocked by a ModSecurity firewall rule returns a 406 error. Look for the visitor’s IP address or the page address in the “Mod Security (WAF)” tab: if the request is “🚫 Blocked”, note the rule number. The help article How to fix a 406 error and find the source of the problem? explains the next steps.
A 403 error is not returned by ModSecurity rules. Look at the “Protection” tab, then “Access & Errors” with the “4xx” filter. The help article How to fix a 403 Forbidden error on your site? details the possible causes.
In “Access & Errors”, use the “> 1s”, “> 2s” and “> 5s” filters. The “PHP-FPM” tab shows the slowest script and the “Cache” tab shows the share of pages served from cache.
The tool displays at most the last 7 days. Raw access logs can be downloaded for 15 days with “📦 Raw logs”.
No, the tool does not offer this option. Download them with “📦 Raw logs”, then send them wherever you want.
He is the AI assistant for LWS Log Analyzer. Click the 💬 bubble at the bottom right of the screen to ask him a question about your logs, for example “Is my site under attack?” or “Why am I getting 500 errors?”.
Ask the LWS team and the community. Answers are published after moderation.
 About LWS :
LWS is a 100% French web hosting company that focuses on quality and innovation and offers a responsive and competent technical service at affordable prices.


 Yes
 No