
Online help
The web host accessible to all
Procédure
Your site is slow, shows a 503 error, or went down for a few minutes? The “Resources (CPU, RAM...)” page in your LWS Panel shows, in graphs, what your hosting consumes: processor, memory, processes, files, server-returned codes, MySQL databases and traffic. By reading it over the period of the issue, you can tell whether your site is reaching the limits of its plan or whether the cause lies elsewhere. This help shows you what to look at and what to do next.
In your hosting’s LWS Panel, under “Optimization and performance,” click “Resources (CPU, RAM...).” The page can also be opened from the “Bandwidth” link in the “Quota summary” on your hosting dashboard.
In the “period selection” list, choose a period that covers the time when your site was slow or in error: from “1h” to “24 Months” (“24h” by default). For a problem from the past week, choose “1 Week.” The page has three tabs: “WEB Resources” (open by default), “MySQL Resources” and “Network Resources.”
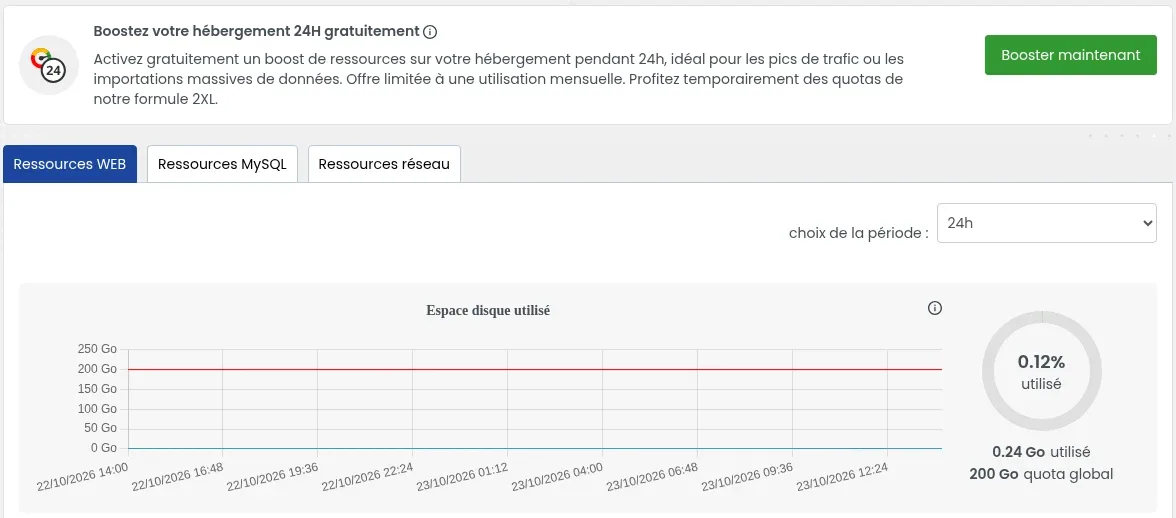
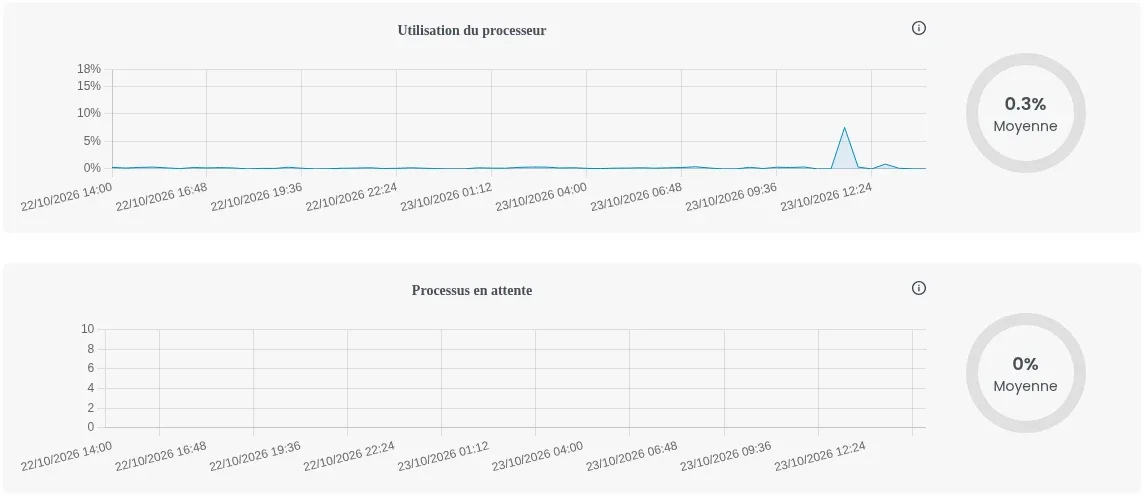
Each graph shows the trend over the chosen period. The circle on the right gives a summary (average, percentage used or number of errors) and the “i” icon gives a short explanation. When a graph has a red line, it marks your hosting limit: a curve that touches it indicates saturation.
| Graph | What it shows | Sign of saturation |
|---|---|---|
| “Disk space used” | The space occupied by your sites’ files | The curve gets close to the red line (quota) |
| “Number of inodes” | The number of files and folders on your hosting | The curve gets close to the red line (quota) |
| “Processor usage” | The share of the processor used by your sites | Strong, repeated spikes at the time of slowness |
| “Pending processes” | Your sites’ tasks waiting their turn to be executed | The curve rises above 0 |
| “Memory usage” | The RAM used by your sites | The curve touches the red line (limit) |
| “Errors reported on memory usage” | The number of times the memory limit was reached | The circle shows more than 0 errors |
| “HTTP codes” | The responses sent by the server to visitors, with a counter for each code | 500, 502, 503, 504 or 509 at the time of the problem |
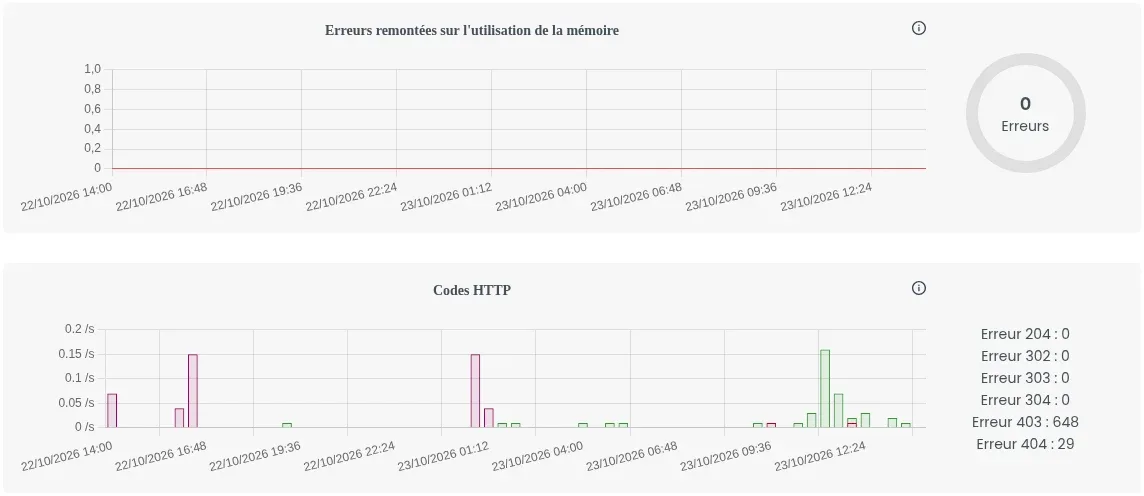
In “HTTP codes,” all counters are called “Error,” but they do not all indicate a problem: 204, 302, 303 and 304 are normal responses (redirects, page the browser already had). A 403 is forbidden access, a 404 a missing page: they do not come from a lack of resources. The meaning of each code is explained in the help How do I fix HTTP error codes?
In the “MySQL Resources” tab, first choose in the “Mysql User” list the one for your site’s database. The “Processor usage,” “Pending processes” and “Number of connections” graphs then show the load on that database, followed by the number of queries (“Select,” “Update,” “Other”). If your site displays a “User has exceeded the max_questions” or “max_user_connections” message, follow the help I am getting this error message = User has exceeded the max_questions / max_connections / max_updates resource, what should I do?
In the “Network Resources” tab, “WEB bandwidth usage” shows what your site has consumed, and “Current WEB bandwidth quota duration” shows the number of days elapsed in the 30-day period. Beyond the bandwidth provided by your plan, the speed is reduced: the values for each plan are in the help Quotas for LWS Linux shared web hosting plans.
Start with the case that most closely matches what your graphs show, and stop as soon as your site works normally again.
The green “Boost now” button, at the top of the page, gives your hosting for free the quotas of the LWS 2XL plan for 24 hours: more execution time and memory for PHP, a faster processor and more processes. It can be used once a month. The procedure is explained in the help How do I boost my hosting quotas for 24 hours?
If memory often touches its red line, if memory errors appear or if processes are waiting day after day, your site needs more than your plan provides:
Identify in the LWS Panel file manager what is taking up space: old backups, caches, logs. Your hosting space is reserved for your sites’ files: download your backups to your computer instead of keeping them on the hosting.
These are denied accesses, often bots blocked by your hosting firewall: this is not a lack of resources. If a legitimate action on your site is blocked, the firewall history shows which rule denied it: see Web application firewall.
The slowness or error does not come from the limits of your plan. Look for the cause in your site itself: an extension, a theme or a PHP error. Error logs will point you in the right direction (How do I access Apache / PHP logs?), then follow the help for the displayed error: How do I fix HTTP 503 Service Unavailable error? or How do I fix a 500 error on your site with LWS Panel?
After enabling a cache, lightening your site or changing plans, come back to “Resources (CPU, RAM...)” a few hours later and choose “24h” in “period selection.”
This e-mail indicates that a limit of your plan has been reached. The checks to carry out, and the case of alerts on MySQL databases, are in the help MySQL quota or resource alert e-mail: what should I do?
They are all gathered, plan by plan, in the help Quotas for LWS Linux shared web hosting plans.
Yes. The “period selection” list goes back to “24 Months”: choose “1 Month” or “6 Months” to find an older spike.
The boost can only be activated once a month. In the meantime, enable a cache and lighten your site; if the limits are reached every month, a higher plan is more suitable.
Ask the LWS team and the community. Answers are published after moderation.
 About LWS :
LWS is a 100% French web hosting company that focuses on quality and innovation and offers a responsive and competent technical service at affordable prices.


 Yes
 No